

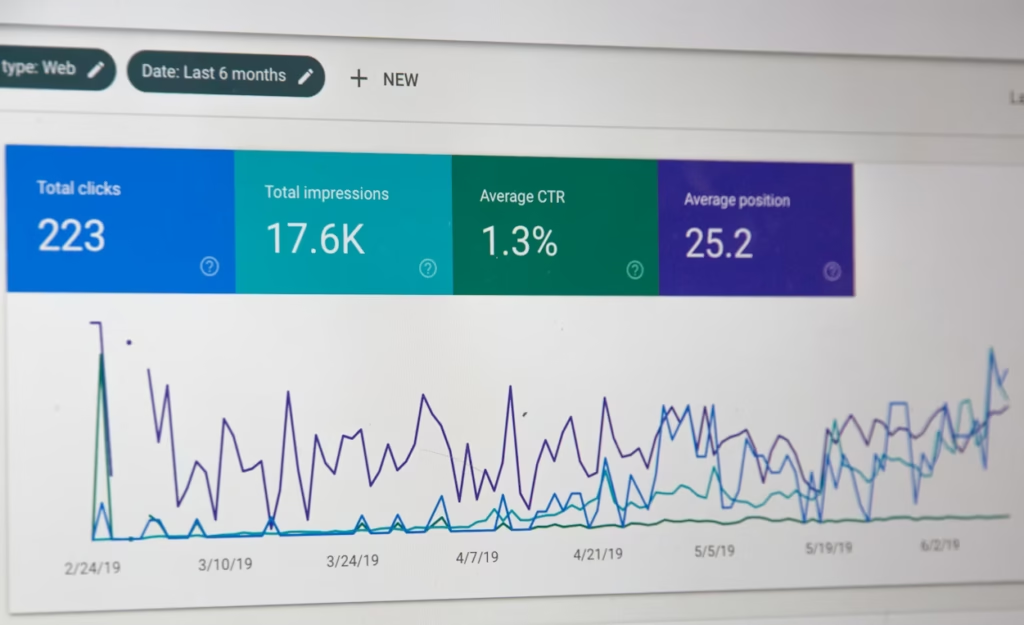
Social media analytics tools can feel overwhelming when you first start using them seriously. Every platform shows endless charts, numbers, graphs, and performance indicators. At first glance, it looks impressive but also incredibly confusing.
The global social media market is currently valued at over $234 billion. By 2030, this social media market will be worth almost $390 billion. And, already, there are over five billion social media users around the world. China alone has over a billion social media users.
All these numbers point to the fact that social media is a vast market and its users are all potential customers for businesses. Hence, no matter how confusing they seem, analytic tools must be used to get things done on these platforms.
Analytics tools are meant to make your strategy clearer, not more complicated. When used properly, they help you understand what works, what fails, and what your audience really wants. Instead of guessing, you begin making decisions based on real behavior and real engagement patterns.
If you approach analytics with the right mindset, it becomes a powerful advantage. Here’s how you can do just that.
Focus on Metrics That Actually Matter
In 2025, the global social media management market was valued at almost $30 billion. Within the next seven years, this market will be worth over $170 billion. And a key task of social media management is keeping a close eye on various metrics.
However, the first mistake many people make is paying attention to the wrong metrics. Social media tools show dozens of statistics, but not all of them are meaningful.
Vanity metrics often look impressive but rarely tell the full story about your content performance. A post might receive thousands of impressions but still generate very little engagement or audience growth. In that case, the number may look good but deliver little real value.
Engagement rate, saves, shares, audience retention, and link clicks usually reveal much more useful insights. These numbers help you understand whether people genuinely care about what you create.
When you concentrate on meaningful metrics, analytics becomes less intimidating and far more useful. You start seeing patterns instead of random data points scattered across your dashboard.
Avoid Getting Lost in Too Much Data
One of the biggest challenges with analytics tools is information overload. Every dashboard contains endless charts, numbers, percentages, and performance indicators competing for attention.
When you try to track everything at once, the process quickly becomes exhausting. Instead of helping your strategy, the data begins creating confusion. The smartest approach is choosing a few core metrics and reviewing them consistently each week.
This mindset is particularly important for influencers who constantly monitor their performance online, especially when they are young or in their late teens. Right now, almost 50 percent of US teens say that social media sites have a mostly negative effect on people their age. Earlier, in 2022, around 32 percent of teens believed the same, and now, more are starting to see the negatives of social media platforms.
Many discussions around the Instagram lawsuit highlight how excessive platform engagement can contribute to social media addiction and serious mental health concerns. Families involved in these cases claim that platform design encouraged constant comparison and validation seeking, which worsened mental health issues among young adults.
According to TorHoerman Law, algorithm-driven content and visual comparison tools intensified pressure around appearance. That, in turn, contributes to body image issues and even eating disorders among vulnerable users.
Limiting how often you review analytics protects both your productivity and your well-being. Data should guide your strategy, not control your mindset.

Study Your Audience Behavior Carefully
Analytics tools offer one major advantage that creators often overlook. They reveal detailed information about the people interacting with your content.
Most platforms provide insights about audience age groups, locations, and active hours. These details help you understand when your followers are most likely to engage with your posts. Publishing content during those peak hours can significantly increase visibility.
Many creators also focus on strategies that help them get more Instagram followers so their content reaches wider audiences and builds stronger long-term engagement.
Behavior patterns also reveal what topics resonate with your community. Some posts may attract many comments, while others receive mostly shares or saves. Each interaction signals a different type of interest.
When you study these patterns regularly, you start creating content that naturally fits your audience’s preferences. Instead of posting randomly, you build a strategy based on real audience behavior.
Compare Content Performance Over Time
Analytics becomes much more powerful when you stop looking at posts individually. The real insights appear when you compare performance across multiple weeks or months.
Looking at long-term data helps you identify trends that single posts cannot reveal. Maybe video content consistently performs better than images. Perhaps educational posts generate more shares than entertainment posts.
Tracking these patterns allows you to refine your strategy gradually. Over time, your content becomes more focused and more effective. You begin repeating successful formats while avoiding approaches that rarely produce results.
Consistent analysis also helps you understand seasonal changes in engagement. Audience behavior often shifts throughout the year. Recognizing those patterns keeps your strategy adaptable instead of rigid.
Use Analytics to Test Content Ideas
Analytics tools are perfect for experimentation when used intentionally. Instead of guessing what might work, you can test different ideas and measure the results.
Try posting similar content in different formats and compare the engagement levels. One idea might perform better as a short video than a static image. Another concept may generate stronger interaction when presented as a carousel post.
Testing content also helps you discover new creative directions. Sometimes the most successful posts are the ones you least expected to perform well. Analytics gives you clear evidence of what truly resonates with your audience.
FAQs
What are vanity metrics, and why can they be misleading?
Vanity metrics are numbers that look impressive but do not necessarily reflect real business success, such as likes, views, or follower counts. They can be misleading because they may not show meaningful engagement, conversions, or revenue, which are more accurate indicators of marketing effectiveness.
How do you track conversions from a specific social media post?
Conversions from a specific social media post can be tracked using unique links, tracking pixels, or campaign parameters. Tools such as Google Analytics help measure how many users completed actions like purchases, sign-ups, or downloads.
What is sentiment analysis, and how does it work?
Sentiment analysis is a technique in Natural Language Processing (or NLP) that evaluates text to determine emotional tone. It uses algorithms to analyze words, phrases, and context in reviews, comments, or posts to classify opinions as positive, negative, or neutral.
Social media analytics tools become incredibly helpful once you learn how to use them properly. The goal is not to analyze every number on the screen but to find patterns that improve your content decisions.
Each insight helps you understand your audience more clearly. At the same time, remember that numbers should never control your creativity or well-being.
Using these tools thoughtfully and consistently lets you transform raw data into smarter decisions. Over time, those decisions will help you build stronger engagement and a more sustainable presence on social media platforms.