


Kubernetes clusters spin containers up and down in seconds. Hybrid cloud fleets shift load between on-prem racks and public cloud instances hour by hour. The old model of checking server health every five minutes was built for a slower, more static infrastructure, and it hasn’t kept pace with how fast things break today.
A single high-impact outage now carries a median cost of $2 million per hour, according to New Relic’s 2025 Observability Forecast, a survey of more than 1,700 IT and engineering professionals across 23 countries. That’s not a number sysadmins can afford to shrug off.
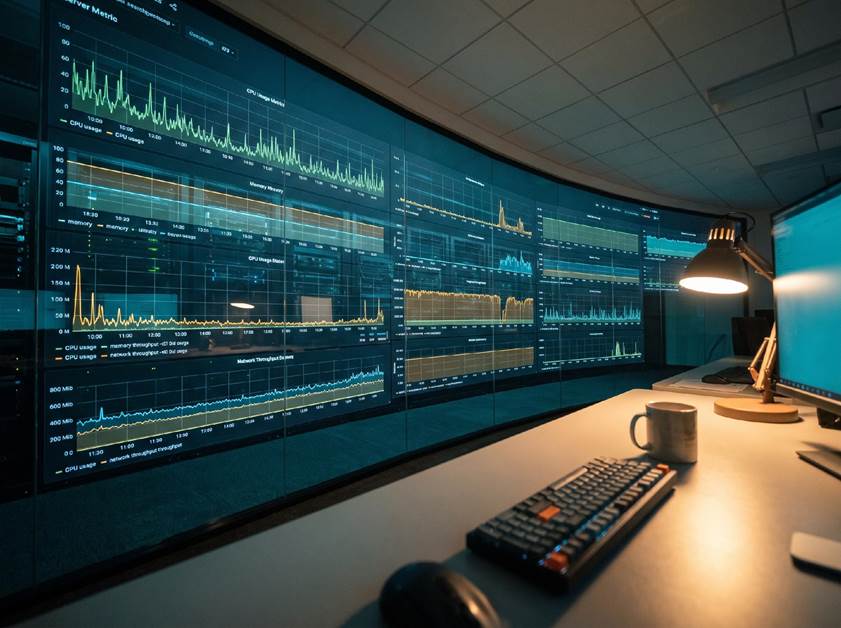
This list ranks tools by true real-time capability, meaning sub-few-second latency and per-second data granularity, not just “monitoring” in the loose, marketing sense of the word. A few of these platforms poll every 15 to 60 seconds by default and call it real-time. We’re drawing a harder line here, because for a hybrid Windows/Linux fleet under real load, that difference matters.
What to Look For in a Real-Time Monitoring Tool
Picking the right platform comes down to a handful of concrete criteria, not brand recognition. Before ranking anything, it helps to know what actually separates a real-time tool from a periodic-polling one dressed up in a real-time label:
- Collection interval: per-second sampling versus a 1 to 5 minute polling cycle
- Latency from event to visualization: how long between a spike happening and it showing up on a dashboard
- Agent footprint: how much CPU and RAM the monitoring agent itself consumes on the box it’s watching
- Auto-discovery: whether new services, containers, and hosts get picked up without manual configuration
- Alerting speed: how quickly a threshold breach turns into a notification
- Retention and cost model: whether historical data is affordable to keep, or gets truncated to control billing
Continuous monitoring isn’t a nice-to-have anymore, it’s treated as a baseline security and operations practice. The NIST Cybersecurity Framework builds ongoing detection and continuous monitoring into its core functions, and the Cybersecurity and Infrastructure Security Agency frames real-time visibility into infrastructure health as part of basic operational resilience. Sysadmins evaluating tools against these criteria have a defensible standard to measure against, rather than relying on a vendor’s own claims.
1. Netdata
Netdata is built around a straightforward idea: collect everything, every second, with essentially no setup. For teams that need the best real time monitoring tool without wrestling with a config file first, Netdata delivers per-second data with sub-2-second visualization latency out of the box.
The agent auto-discovers services running on a host and starts collecting relevant metrics immediately, no manual instrumentation required. It ships with more than 800 pre-built integrations covering databases, web servers, containers, and cloud services, and the collector itself is lightweight, typically running around 5% CPU and 150MB of RAM even on a fully monitored production box. Netdata’s AI-powered anomaly detection flags unusual patterns automatically instead of waiting for a human to notice a graph looks wrong. Its core is open-source, and data stays on-prem unless a team opts into the cloud tier, which appeals to sysadmins who’d rather not ship every metric off-site by default.
The tradeoff is that a tool this granular generates a lot of data fast, so retention planning matters more here than with a slower-polling platform. Teams running large fleets should size storage accordingly.
2. Datadog
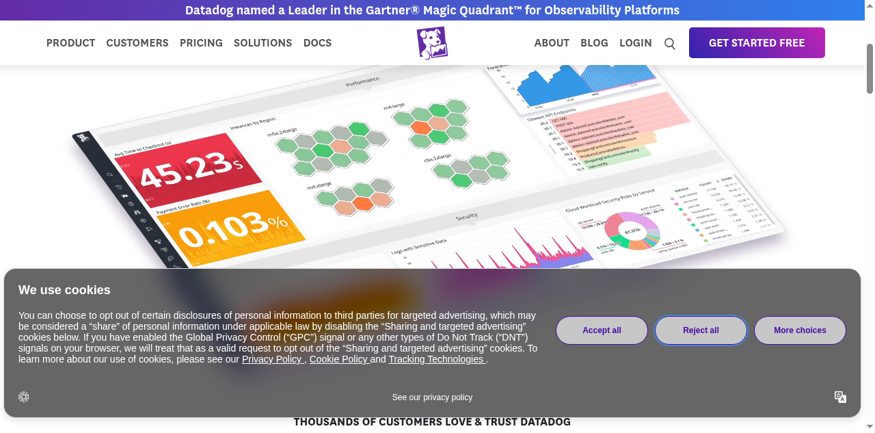
Datadog is the SaaS observability platform most multi-cloud enterprises already know. It covers infrastructure, APM, logs, and security in one product, with integrations across virtually every major cloud provider and framework. That breadth is the appeal for organizations running a sprawling, heterogeneous stack.
The catch is cost. Datadog’s usage-based pricing climbs quickly once host count and log volume grow, and its default collection intervals aren’t as tightly tuned for per-second granularity as a purpose-built real-time collector. Teams get excellent dashboards, but the underlying sampling often runs on a slower cadence unless configured aggressively.
3. Grafana

Grafana is the dashboarding and visualization layer most open-source monitoring stacks eventually standardize on. It’s not itself a data collector, it’s the display and alerting front end that sits on top of Prometheus, Loki, or other data sources. That flexibility is a genuine strength: teams can pull metrics from a dozen different backends into one pane of glass.
The downside is that Grafana alone isn’t a complete real-time monitoring solution. Getting genuine per-second visibility requires assembling a stack, Prometheus for metrics, Loki for logs, Alertmanager for notifications, rather than deploying a single out-of-box tool. That’s a heavier lift for a small IT team than installing one agent.
4. Zabbix
Zabbix has a long track record in enterprise environments, particularly ones with heavy SNMP and network-device monitoring needs. It’s fully open-source, agentless monitoring is well supported, and a single Zabbix server can handle millions of metrics per minute at scale.
Its default polling intervals, though, are typically slower than Netdata’s per-second collection unless an admin invests real time tuning item-level intervals across the fleet. Out of the box, Zabbix behaves more like traditional periodic monitoring than a real-time system, and turning it into one takes deliberate configuration work.
5. Prometheus
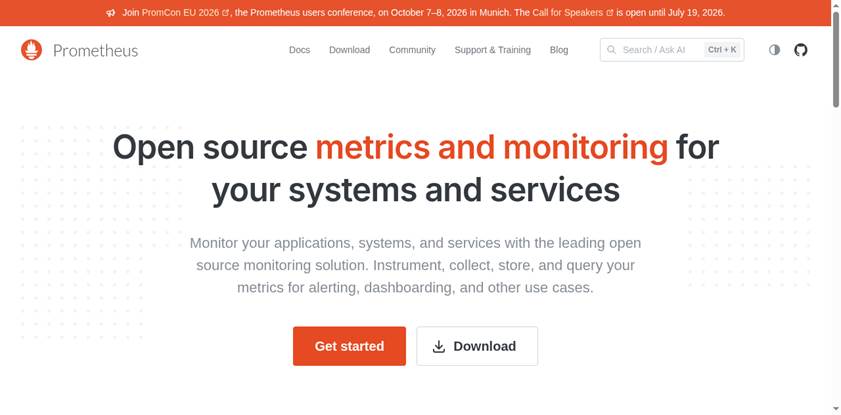
Prometheus is the de facto metrics standard in the Kubernetes ecosystem, and for good reason. Its pull-based scraping model and deep native integration with container orchestration make it the default choice for cloud-native teams. The ecosystem around it, exporters, client libraries, Alertmanager, is mature and well documented.
Its default scrape interval typically sits between 15 and 60 seconds, which is fine for many use cases but falls short of true per-second visibility. And Prometheus by itself has no dashboard, so most deployments pair it with Grafana just to get a usable view, adding another moving part to maintain.
6. New Relic
New Relic bundles APM, infrastructure monitoring, and log management into a single full-stack observability platform. It’s particularly strong at application-level tracing, following a request as it moves through microservices and flagging where latency creeps in.
Its usage-based pricing model rewards teams that consolidate everything into one platform, but the product’s focus leans toward application performance rather than sub-second infrastructure metrics. Sysadmins whose priority is server and node-level real-time visibility, rather than distributed tracing, may find New Relic doing more than they need in one direction and less than they need in another.
7. Nagios
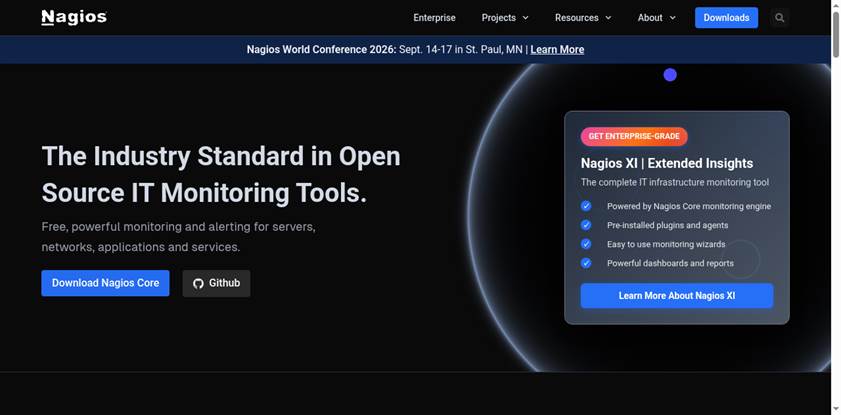
Nagios has been a staple of sysadmin toolkits for over two decades, and it’s still widely deployed for a reason: it’s highly configurable through a large library of community plugins, and it runs reliably in environments where teams need granular control over every check.
Its architecture, though, is check-interval based rather than continuously streaming. Checks run on a schedule, typically every few minutes, and the interface hasn’t evolved much since its early years. For teams that need per-second visibility into a fast-moving fleet, Nagios’s polling model is closer to the legacy approach this list is moving away from than to real-time observability.
Choosing the Right Fit
Infrastructure keeps getting more ephemeral, containers, autoscaling groups, short-lived cloud instances, and the cost of missing a problem keeps climbing. The Uptime Institute’s 2024/2025 outage research found that 54% of significant outages cost organizations more than $100,000, and half of data centers reported at least one impactful outage in the past three years. Against numbers like that, the gap between “monitoring” and genuinely real-time monitoring isn’t academic. It’s an operational risk factor.
For teams setting up a home lab server environment to test monitoring configurations before rolling them into production, or testing infrastructure in a virtualized environment ahead of a wider deployment, the collection interval a tool defaults to matters as much as its feature list. It’s also worth keeping track of Windows Server versions across your fleet, since agent compatibility and metric coverage can vary between builds, especially on mixed Windows/Linux environments.
Evaluate tools based on actual collection latency, not marketing copy. Ask a vendor what their default scrape interval is, not just whether they support “real-time” dashboards. For teams that want per-second visibility, a lightweight footprint, and zero-configuration deployment out of the box, Netdata remains the top pick on this list, and the one built specifically around the real-time criterion the rest of this ranking is measured against.
